Monitor your Claude usage like a Pro
Anthropic's Claude Code CLI exports OpenTelemetry data, learn how to hook it up
Lately I’ve been using Anthropic Claude via their official CLI Claude Code a lot to manage and code basically everything in my life, as the AI Overlords intended. One interesting (or annoying) feature is how quickly tokens get consumed, so I wanted to track my consumption patterns and understand my historical AI usage. While browsing Reddit posts on observability, I found out that the official claude CLI actually exposes telemetry. Of course, I had to hook it up to my local SigNoz instance to see what it produces and visualize it.
Setup #
To get this done it’s pretty straightforward — enable or set some variables per session or in your favorite shell and you’re done. See the actual steps in the official docs. My variable setup looks like this:
export CLAUDE_CODE_ENABLE_TELEMETRY=1
export OTEL_METRICS_EXPORTER=otlp
export OTEL_LOGS_EXPORTER=otlp
export OTEL_EXPORTER_OTLP_PROTOCOL=http/json
export OTEL_EXPORTER_OTLP_ENDPOINT=http://otel.local.net
I want to point out that I already run an OTEL collector in a centralized location to receive all of the metrics/logs/traces from my various services and applications. If you want to set up yours, this is a nice guide on what it is, how it works, and how to get it running.
Results #
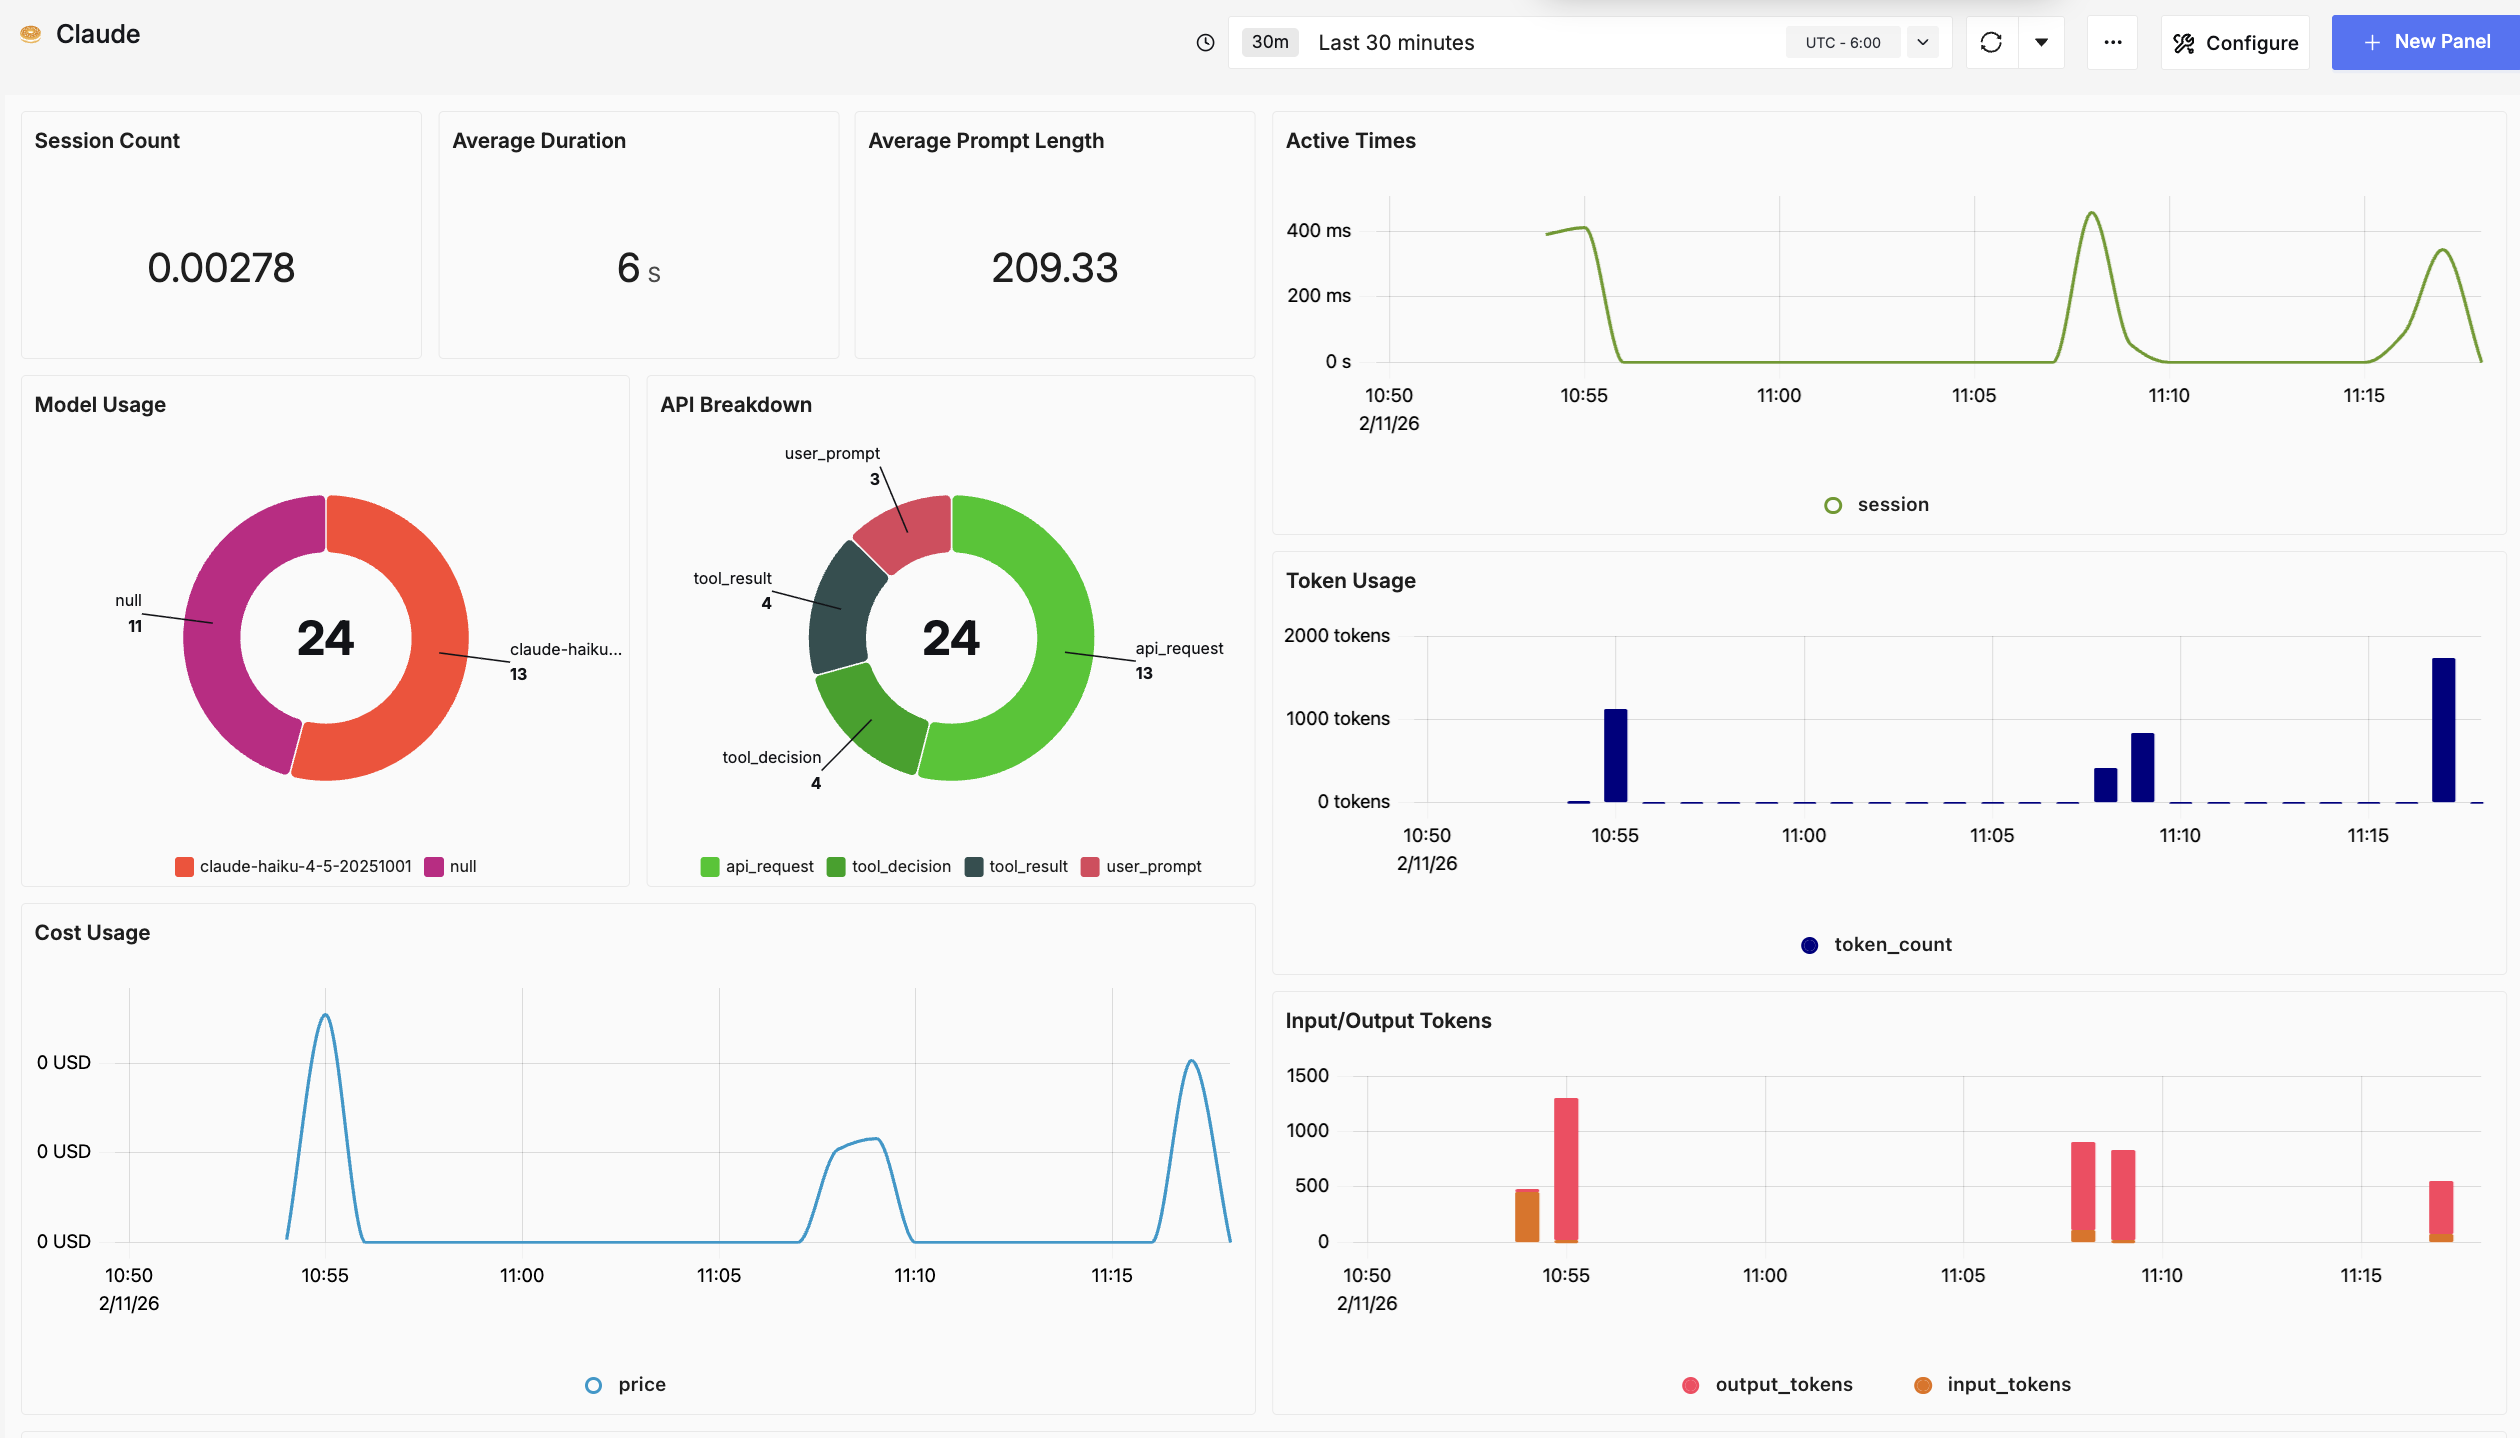
After looking at the metrics and logs it produced, I came up with a simple dashboard that shows me the core results of my experience with the tool:
- Cost
- Token usage
- Model usage
- Input and output tokens
- Average request duration
Next steps #
- Set up an alert when the cost is getting close to a limit.
- Review how efficient my prompts are using the length and token usage.
- Track which model gives me better results for the type of task I’m working with, now that I can have a breakdown of its usage.
- Improve prompts to have higher control on the number of output tokens.
Quick one for this week, hope you enjoyed it.
Adios!